Visualizing tight-binding models#
from pythtb import TBModel, Lattice
import numpy as np
import matplotlib.pyplot as plt
Graphene model#
lat = [[1, 0], [1 / 2, np.sqrt(3) / 2]]
orb = [[1 / 3, 1 / 3], [2 / 3, 2 / 3]]
lattice = Lattice(lat, orb, periodic_dirs=[0, 1])

# make two dimensional tight-binding graphene model
my_model = TBModel(lattice)

# set model parameters
delta = 0
t = -1

# set on-site energies
my_model.set_onsite([-delta, delta])
# set hoppings (one for each connected pair of orbitals)
# (amplitude, i, j, [lattice vector to cell containing j])
my_model.set_hop(t, 0, 1, [0, 0])
my_model.set_hop(t, 1, 0, [1, 0])
my_model.set_hop(t, 1, 0, [0, 1])
TBModel.visualize()#
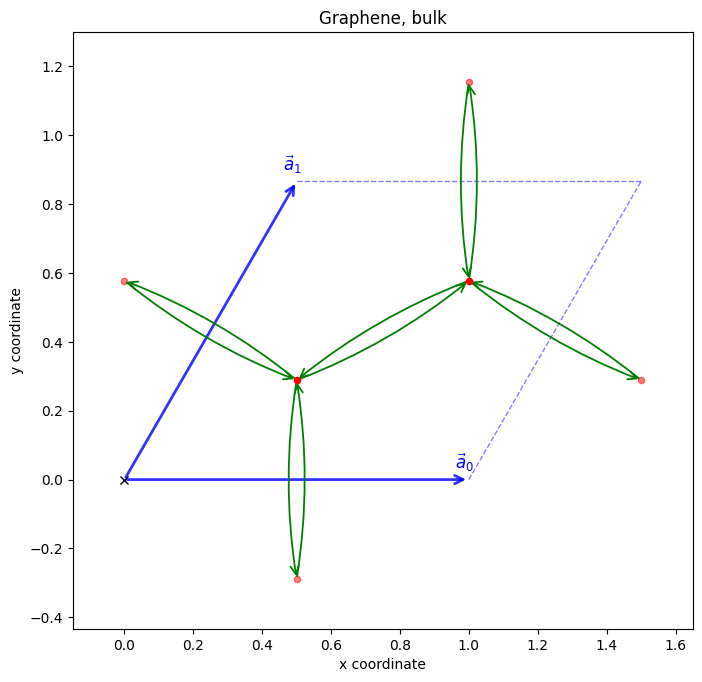
Periodic in both directions#
fig, ax = my_model.visualize()
ax.set_title("Graphene, bulk")
ax.set_xlabel("x coordinate")
ax.set_ylabel("y coordinate")
plt.show()
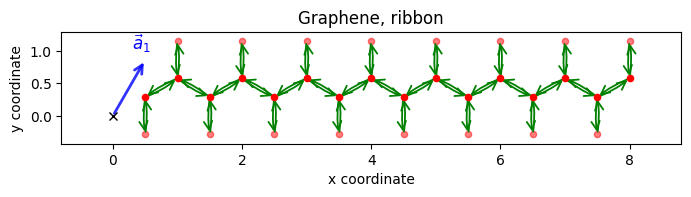
Finite along direction 0#
cut_one = my_model.cut_piece(8, 0, glue_edges=False)

fig, ax = cut_one.visualize()
ax.set_title("Graphene, ribbon")
ax.set_xlabel("x coordinate")
ax.set_ylabel("y coordinate")
plt.show()
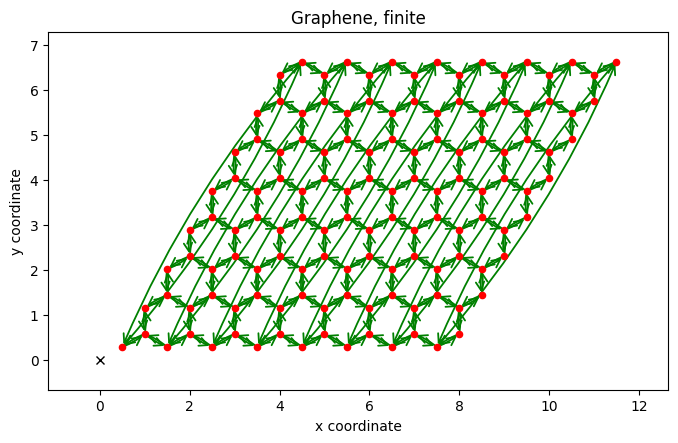
Finite in both directions#
cut_two = cut_one.cut_piece(8, 1, glue_edges=False)

fig, ax = cut_two.visualize()
ax.set_title("Graphene, finite")
ax.set_xlabel("x coordinate")
ax.set_ylabel("y coordinate")
plt.show()
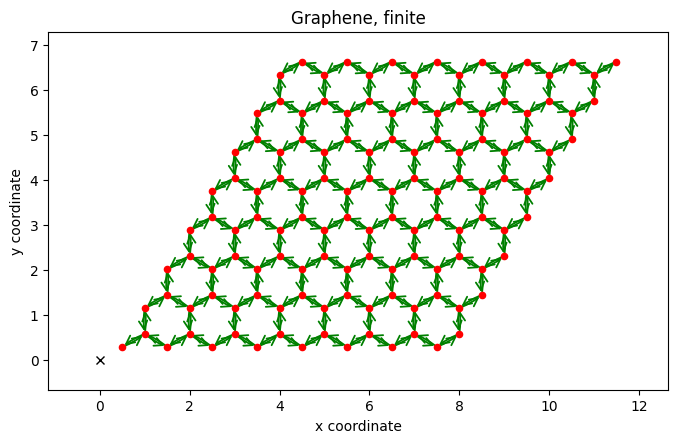
Finite flake with periodic boundary conditions along direction 1#
cut_two = cut_one.cut_piece(8, 1, glue_edges=True)

fig, ax = cut_two.visualize()
ax.set_title("Graphene, finite")
ax.set_xlabel("x coordinate")
ax.set_ylabel("y coordinate")
plt.show()