Python Tight Binding (PythTB)#
PythTB is a Python library for constructing and analyzing tight-binding models, built for modern topological band theory applications. It provides a streamlined path from model specification to physical interpretation, making it useful for both learning electronic structure and conducting research-level studies. With only a few lines of code, you can define lattice models, build tight-binding Hamiltonians, and compute electronic properties.
PythTB 2.0.0 Released!
Quick Links
GitHub - source code and issue tracker
Installation - install instructions and dependencies
API - detailed API reference
Tutorials - Jupyter notebooks demonstrating key features
Development - contributing guidelines and developer docs
Release Notes - discussion of new features by version
Changelog - list of changes by version
Formalism - theoretical background
Citation - how to cite PythTB in publications
Core functionality#
Construct and manipulate tight-binding Hamiltonians with TBModel.
Define lattice geometry with Lattice, on-site and hopping terms, spin structure,
and parameter-dependent model components.
Create structured k-space and parameter meshes, sample model
Hamiltonians, and store eigenstates in WFArray objects for
downstream analysis.
Compute topological invariants and quantum-geometric quantities
with WFArray and TBModel: Berry connection, phases and
curvature; quantum metric and geometric tensor; Wilson loops,
Chern numbers, local Chern markers, hybrid Wannier centers, and
Chern-Simons axion-angle pumping.
Import Wannier90 tight-binding Hamiltonians via W90
for post-processing, band-structure evaluation, and detailed analysis of
topological and quantum-geometric properties.
Perform projection, disentanglement, and construct maximally
localized Wannier functions in a tight-binding framework
using Wannier and WFArray. Evaluate spreads, centers,
localization properties, and topological obstructions.
Plot band structures, density of states, lattice geometries, hopping graphs, and interactive 3D models with built-in visualization utilities.
Get started with PythTB#
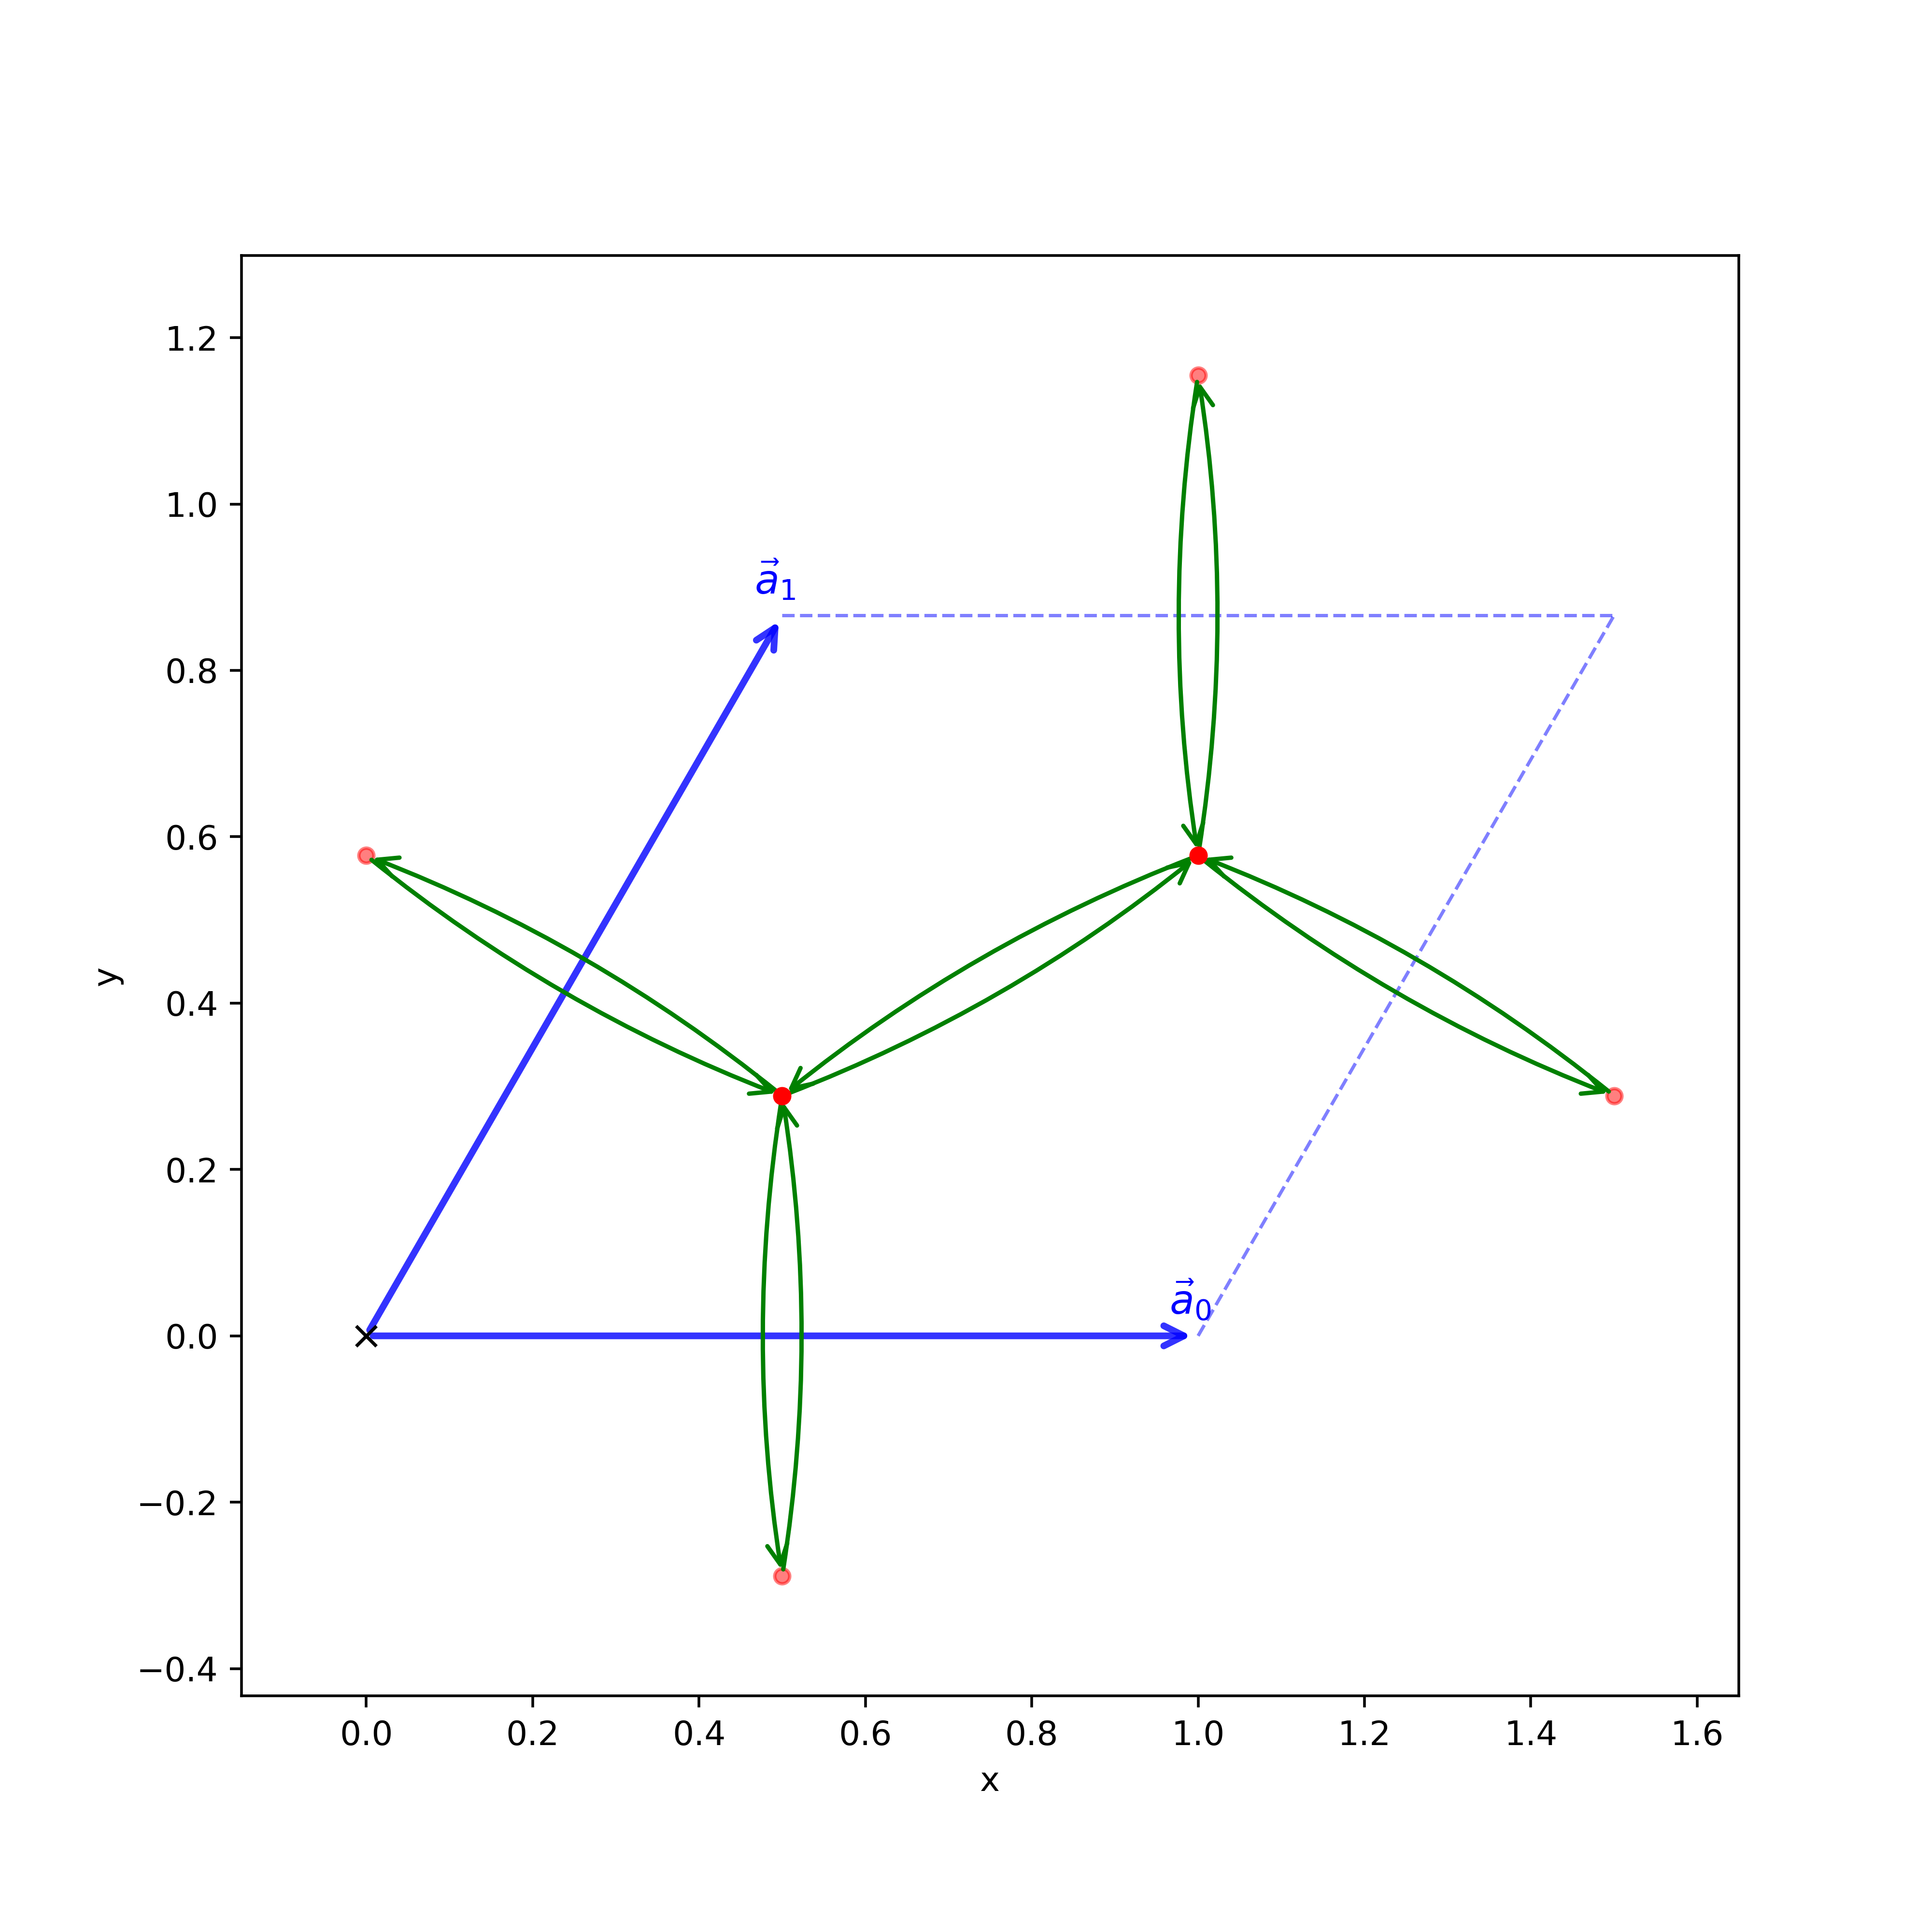
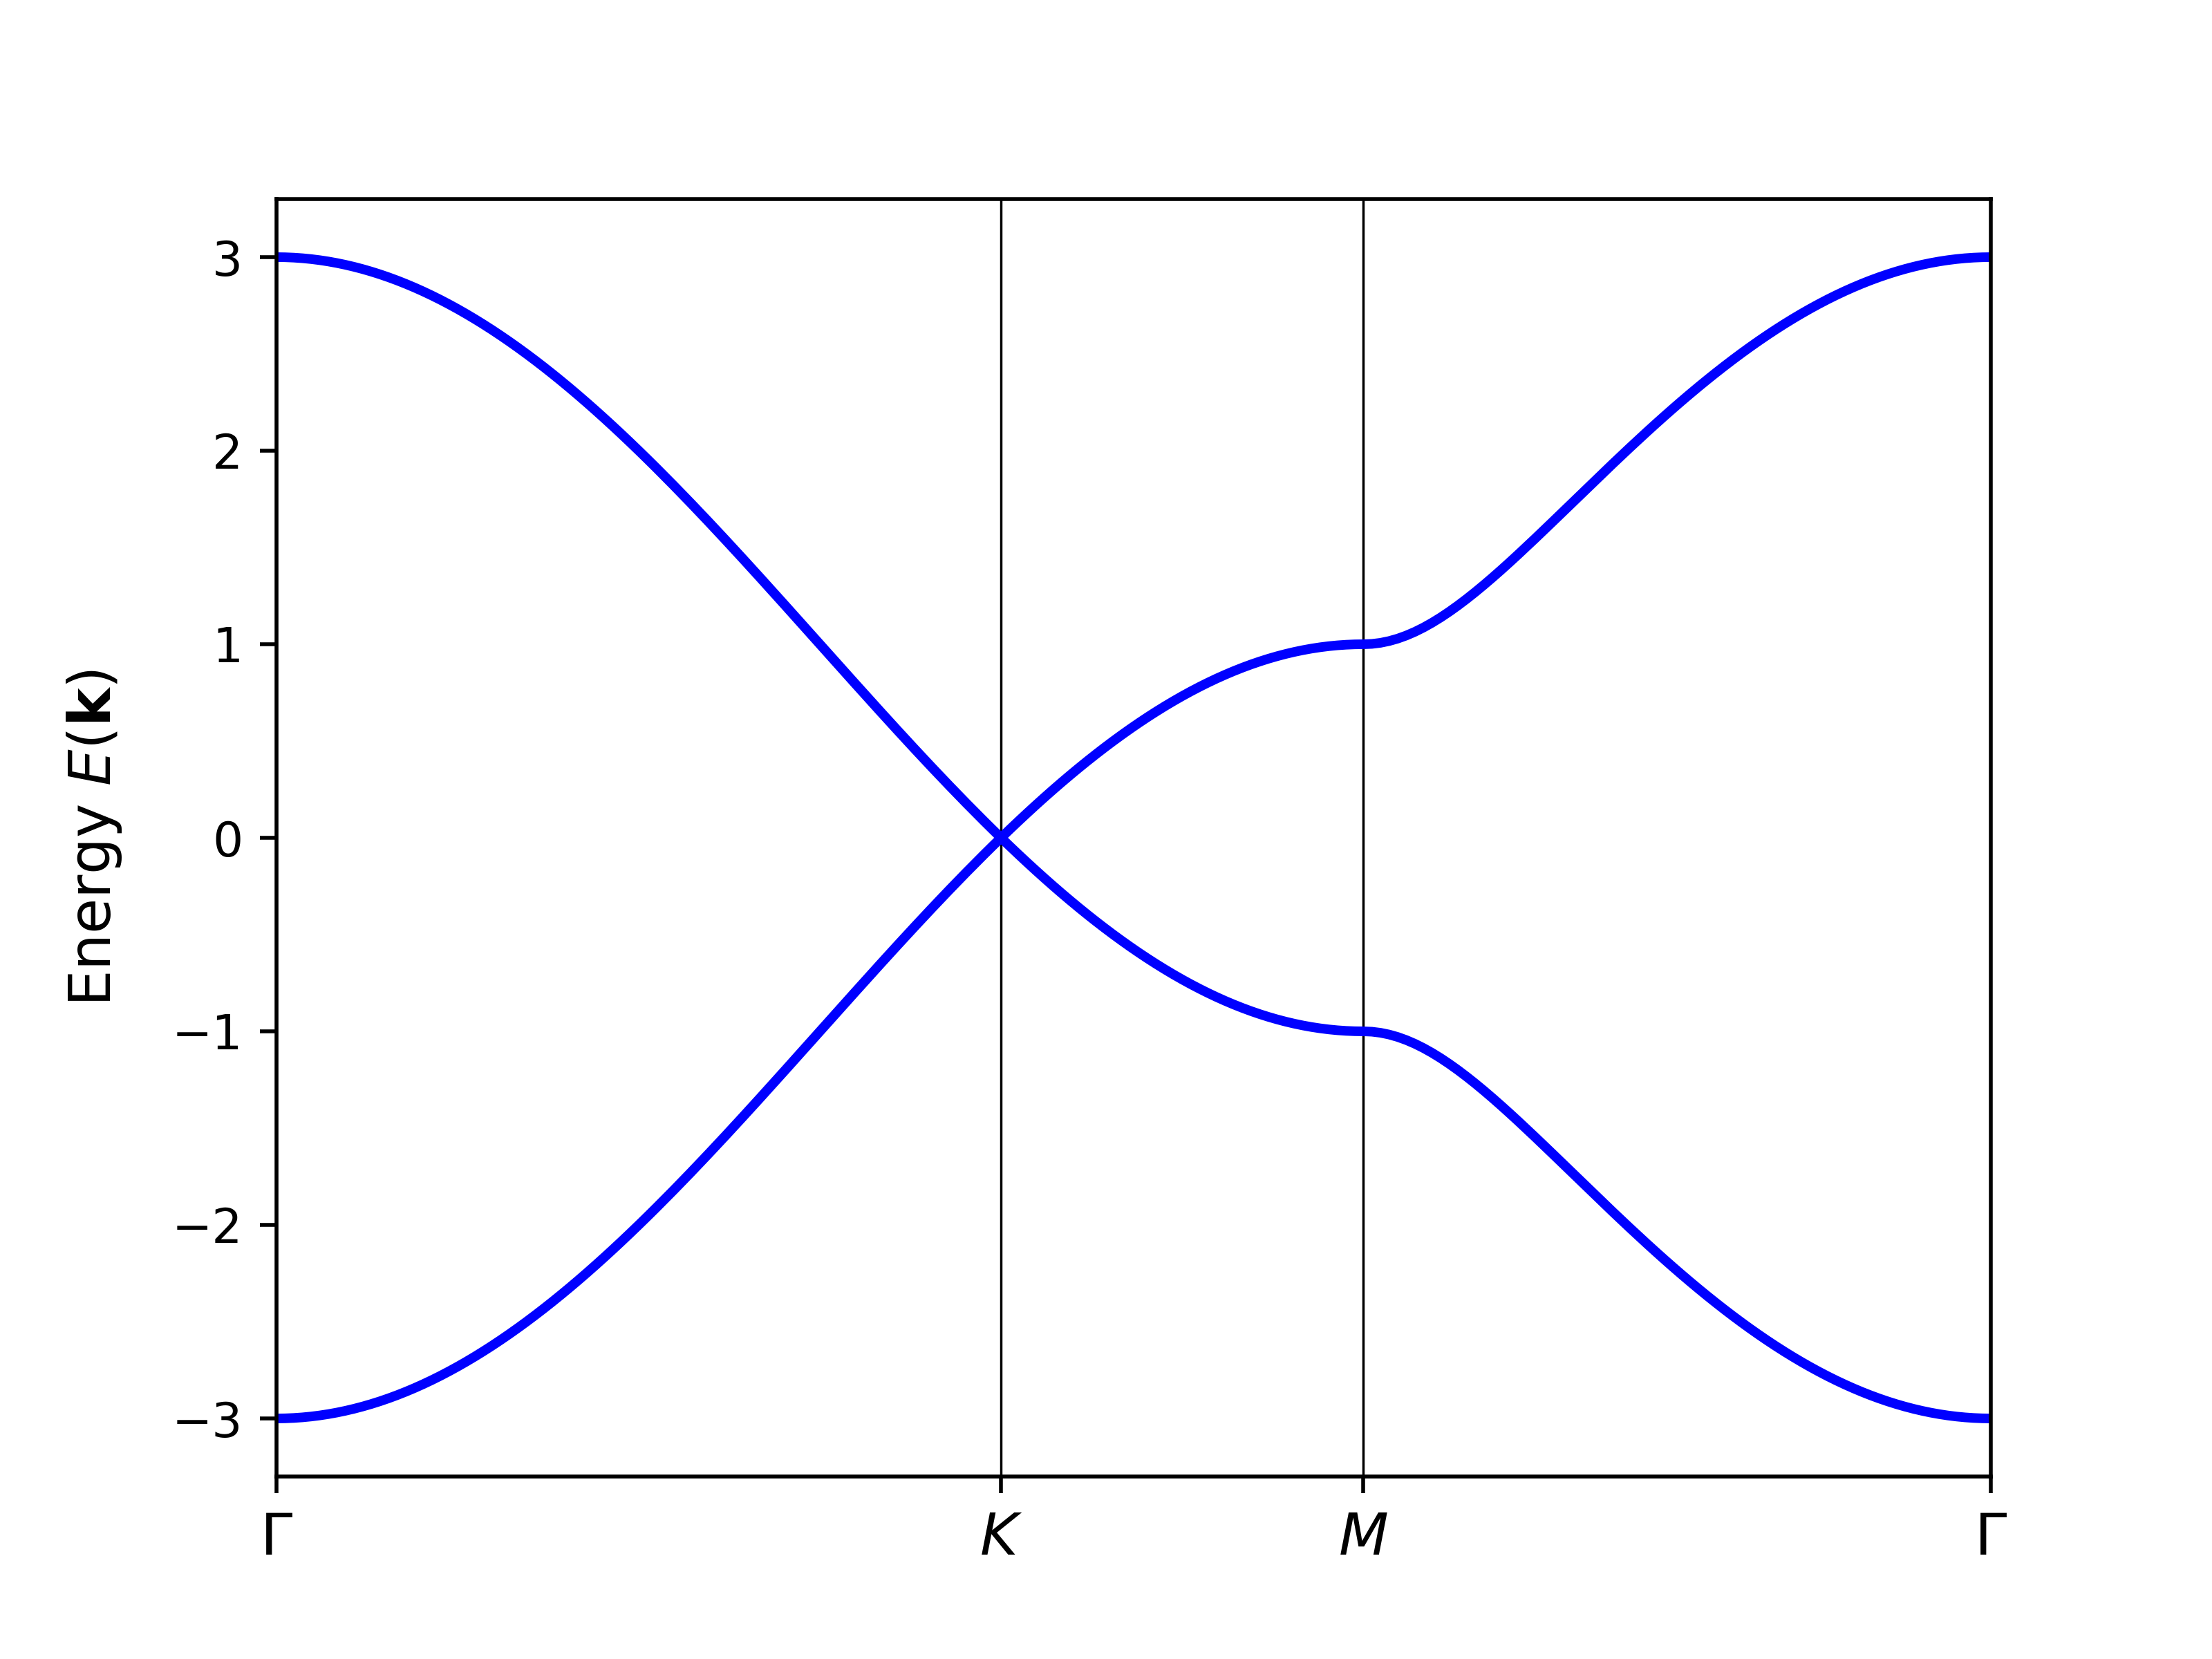
This is a simple example showing how to define graphene tight-binding model with first neighbor hopping only. Below is the source code and plot of the resulting band structure. Here you can find more examples.
from pythtb.models import graphene
import matplotlib.pyplot as plt

# Create graphene TB model and visualize
model = graphene(delta=0, t=-1)
fig, ax = model.visualize()
plt.show()

# Plot band structure along high-symmetry points
nodes = [[0, 0], [2 / 3, 1 / 3], [1 / 2, 1 / 2], [0, 0]]
label = (r"$\Gamma $", r"$K$", r"$M$", r"$\Gamma $")
fig, ax = model.plot_bands(k_nodes=nodes, k_node_labels=label, nk=200)
plt.show()
Feedback#
Please send comments or suggestions for improvement to these email addresses or start a discussion on the GitHub Discussions page. If you find bugs, please report them on the GitHub Issues page.